Applications & Capabilities
Faults Detected
- Semiconductor ESD related faults
- Leakage current and hot spots
- Resistive shorts between gate and drain
- Shorts in mold compound of packaged devices
- Latch-up sites
- Shorts in metallization
- Defective transistors and diodes
- Oxide layer breakdown
- SMD component leakage
Testable Electronic Devices
- Bare semiconductor devices
- Package semiconductor devices
- Wafers
- SMD components
- Bare circuit boards
- Populated circuit boards
- Flex circuits
Features
- High sensitivity lock-in thermography fault isolation
- Defect depth analysis of stacked die
- True temperature mapping using Emissivity Tables
- Visual camera probing
- Junction temperature measurement
- Bare and packaged device analysis
- Front and backside analysis
- Detection of die attach problems
- Thermal resistance evaluation
Lock-in Thermography Fault Isolation
Lock-in thermography (LIT) is a process of automatically and repeatedly powering an electronic device at regular intervals while thermal images of the device are analyzed by software. The following description is over simplified, but helps to provide a basic understanding of the Lock-in Thermography process. Lock-in thermography can identify the x, y location of defects. Additionally, fault depth can also be determined by analyzing the phase angle (or time delay) between voltage application and resulting surface heating. Lock-in thermography tests are used to detect and locate faults such as the following:
- Leakage current and resistive short circuits on semiconductor devices, wafers, SMD components, bare circuit boards and flex circuits
- Power-to-ground short circuits on populated circuit boards
Lock-in Photometry Fault Isolation
Lock-in photometry is a tool similar to Emission Microscopy (EMMI) and Photon Emission Microscopy (PEM) and is used to detect and locate faults on semiconductor devices by detecting emitted photons in the short wave infrared (SWIR) region of the electromagnetic spectrum. A camera sensitive to SWIR energy is used to detect photons with wavelengths between 400 and 1700nm that are emitted by electron-photon recombination caused by faults such as the following:
- P-N junction leakage
- Gate oxide leakage
- Latch-up
- Transistor failure caused by an open or short circuit
True Temperature Mapping and Junction Temperature Measurement
When imaging semiconductor devices, much of the contrast on the image is usually due to emissivity variations, not to temperature variations. Measuring true temperature often requires compensating for the pixel-by-pixel emissivity variations using emissivity tables.
During integrated circuit operation, internal junction self-heating leads to a large concentration of heat at the junction. Accurate junction temperature measurement is an integral part of device thermal characterization. Emissivity tables provide a method to accurately measurement temperature of the junction by compensating for pixel emissivity variations across the die surface.
Die Attach Evaluation
Die attach defects can be due to a number of causes such as inadequate or contaminated die attach material, delamination, or voids. Sentris tools like image subtraction are used to assess the heat flow to determine integrity die bond integrity.
Thermal Resistance Evaluation
The concept of thermal resistance is often used to characterize the thermal performance of packaged devices. Using this approach, device junction temperature can be estimated in different operating modes and environments. Sentris provides accurate temperature measurements at thermal reference points, such as device packaging and heat sinks, to evaluate thermal resistance.
Competitive Advantage
Uncooled Infrared Camera
One of the most important differences between Sentris and many competing lock-in thermography systems for semiconductor failure analysis is the infrared camera technology. Sentris includes an Optotherm uncooled LWIR (7-14 microns) microbolometer camera with less than 40 mK NETD* and 60Hz image capture rate. Competing systems utilize cooled MWIR (3-5 microns) photoelectric cameras with ~20 mK NETD* and ~100Hz image capture rate.
* Noise Equivalent Temperature Difference (NETD) specifies the smallest temperature difference that can be detected.
Test Sensitivity
Lock-in thermography test sensitivity is primarily dependent on infrared camera sensitivity (NETD) and the number of images captured during a lock-in test. Test sensitivity (theoretical) = 0.5 * NETD / (square root(# test images captured)). Therefore, for a specific test time length, cooled MWIR cameras can provide approximately 2X the test sensitive than uncooled cameras. Sentris test sensitivity can be increased however, by simply extending the test time.
Spatial Resolution
When lenses are properly designed, spatial resolution is limited by diffraction to approximately ½ the working wavelength of the infrared camera detector. The working wavelength of the Sentris LWIR camera is approximately 10 microns, and therefore the minimum spatial resolution is ~5 microns. The working wavelength of cooled MWIR cameras is approximately 4 microns, and therefore the minimum spatial resolution is ~2 microns. Some MWIR camera suppliers offer lenses with higher magnification to provide increase spatial resolution of hot spots. In practice, however, increasing lens magnification beyond the diffraction limit will generally lead to lower numerical aperture, shorter working distance, and increased diffraction.
Reliability
MWIR cameras include detector assemblies (called dewars) that must be cooled to cryogenic temperatures as low as 77K (-196.15°C) often using mechanical Stirling engines. Stirling engines are expensive, complex devices whose reliability should be considered when purchasing a system intended for many years of operation.
Lock-in Hardware
The Sentris lock-in thermography software-driven process was developed by Optotherm to simplify and reduce the cost of semiconductor failure analysis. Competing lock-in systems include complex and expensive lock-in amplifiers in order to synchronize captured thermal images with device power.
System Cost
By eliminating the expense involved with cooled infrared cameras and lock-in hardware, the cost of a complete Sentris system is often a fraction of the cost of competing systems.
Functional and Uncomplicated
The innovative Sentris fault isolation process was developed by Optotherm to simplify and reduce the cost of the lock-in thermography process. Traditional lock-in thermography systems include complex function generators and power supplies in order to synchronize device power with the capture of thermal images. By eliminating the need for these complicated and expensive instruments, Sentris provides a straightforward and affordable technique to semiconductor defect isolation.
Advantages Over Liquid Crystal Thermography
Liquid crystal thermography has low sensitivity, slow response, and requires the surface of devices to be coated. These systems are limited to detecting hot spots greater than 0.1°C and because they involve steady-state device powering, the heat generated by faults diffuses through semiconductor material, blurring the location of the defect source. Sentris overcomes the limitations of liquid crystal thermography. No surface coating is required, and hot spots below 0.001°C can be detected. Furthermore, high-frequency lock-in thermography minimizes heat diffusion, enabling the precise location of faults.
Compliments Other FA Tools
Semiconductor devices are becoming smaller, faster, highly integrated, and multi-functional with the result that failures often cannot be found using only one analysis technique. It is often necessary to use multiple tools to pinpoint different types of faults. Sentris thermal emission analysis is often used in conjunction with photon emission and OBIRCH analysis. Photon emission is used primarily to analyze leakage current resulting from gate oxide defects, latch-ups and ESD failures. OBIRCH is most often used to detect leakage current, short circuits and areas of high resistance.
Affordable
The price for a complete Sentris system is a fraction of the cost of competing cooled MWIR lock-in thermography systems.
Technology
Lock-in Thermography
Sentris employs lock-in thermography software and hardware to improve temperature detection sensitivity up to 100X compared with real-time thermal imaging. Lock-in thermography is a process of automatically and repeatedly applying voltage to a faulty circuit at regular intervals. Many different voltage sources can be used (such as source meters and power supplies) with our reed relays that coordinate timing of applied voltage. Sentris software can also control select Keithley source meters and power supplies directly.
In simple terms, during a lock-in test, thousands of thermal images of the device are analyzed during each power cycle. The sum of thermal images captured with applied voltage are subtracted from the sum of thermal images captured with no applied voltage. After many voltage cycles, temperature changes lower than the infrared camera sensitivity can be detected. Increasing the number of voltage cycles results in improved test sensitivity. Test sensitivity is directly dependent upon lock-in test time. As a test continues to run, lower fault heating (and power dissipation levels) can be detected. Localized fault heating <1mK (0.001°C) can often be detected within a few minutes. Overnight tests can detect heating as low as 0.02mK (0.00002°C). Weak sources of heat arising during normal operation of the device may even be detected.
Cycle Frequency can be set from 1 cycle/minute up to 15 Hz. Performing lock-in tests at lower frequencies improves test signal/noise due to higher fault heat up. Higher frequency tests can improve hot spot spatial resolution by reducing thermal diffusion into adjacent areas of the device.
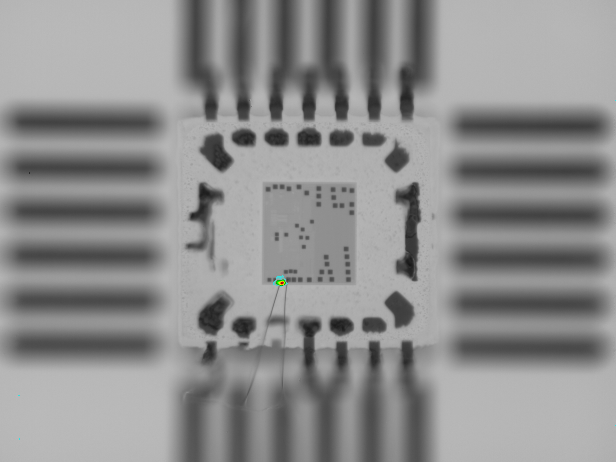
Lock-in Test Results
Lock-in images display the results of a lock-in test. The amplitude image displays heating occurring at any time during the voltage cycle. A single phase image displays heating occurring during a specific time in the cycle. The phase image displays the phase angle each point in the image which represents the time within the cycle that fault heating reaches the surface. When analyzing packaged devices and stacked die, phase angle can be used to estimate defect depth.