


Overview
Lock-in thermography (LIT) enables detection of low-level thermal signatures in semiconductor devices (IC packages) and electronic assemblies, with sensitivity down to <100 µK and power dissipation below 1 µW.
The system applies a periodic electrical stimulus to the device under test, captures synchronized thermal images, and integrates the signal over multiple cycles. By subtracting baseline images and analyzing phase and amplitude, extremely small temperature variations can be isolated from background noise. Sensitivity improves with the square root of the number of integration cycles, enabling detection of progressively smaller heat sources with longer acquisition times.
Competitive Advantage
Steady-state thermography is limited to detecting hot spots that exceed approximately 100 mK (0.100°C). While effective for high-power faults, it is not capable of detecting low-power defects such as leakage currents or high-resistance shorts. In addition, thermal diffusion reduces spatial resolution, making precise localization difficult.
Optotherm Lock-in Thermography Software enables detection of temperature changes down to <100 µK (MWIR) or <1 mK (LWIR), and power dissipation below 1 µW(MWIR) or 10 µW (LWIR), allowing precise localization of leakage currents, resistive shorts, and other failure mechanisms that are not visible with steady-state thermal imaging.
How it works:
- Apply periodic electrical stimulus to device under test
- Set excitation frequency based on sensitivity/resolution requirements
- Capture synchronized thermal image sequences
- Subtract powered and unpowered image frames
- Compute amplitude and phase images from integrated signal
Applications
Lock-in thermography is used to detect and locate the following faults:
- Leakage current and resistive short circuits on semiconductor devices (IC packages) and electronic assemblies
- Applicable to wafers, packaged devices, SMD components, bare circuit boards, and flex circuits
- Power-to-ground short circuits on populated circuit boards
Related techniques:
Leakage Current Localization
Leakage current in semiconductor devices occurs when charge carriers runnel through insulating regions or unintended conduction paths, typically within transistors or between interconnects. These leakage paths generate extremely small amounts of heat, often below the detection threshold of steady-state thermography, making them difficult to identify—especially in densely integrated circuits.
Because of its high temperature detection sensitivity, lock-in thermography is an effective tool to detect and pinpoint leakage current. The resulting amplitude and phase images allow precise localization of leakage paths, even in complex semiconductor structures.
Low-Resistive Short Detection
Low-resistance shorts create unintended low-impedance current paths, resulting in significant localized current flow when voltage is applied. This produces relatively high power dissipation and strong thermal signatures at the fault site.
Because of the higher heat generation, these defects are often detectable with conventional thermal imaging. However, lock-in thermography improves detection by enhancing signal clarify and reducing background noise. The resulting thermal images provide precise localization of the short, even in complex circuit layouts.
High-Resistive Short Detection
High-resistive shorts generate very low current and minimal power dissipation, often producing thermal signatures that are below the detection threshold of steady-state thermography. In many cases, background heating from normal circuit operation can make the fault site, making isolation difficult.
Lock-in thermography overcomes this limitation by applying a periodic electrical stimulus and isolating the synchronized thermal response through phase-sensitive detection. This allows small, time-correlated heat signals from the fault to be separated from unrelated background heating. For semiconductor devices, applied voltage is typically limited (e.g., ~0.5 V) to avoid activating normal device operation and introducing additional heating that could obscure the defect.
Specifications
Power Sensitivity | <1 µW (MWIR), <10 µW (LWIR) |
Temperature Sensitivity | <100 µK (MWIR), <1 mK (LWIR) |
Sensitivity Scaling | Improves with √N (number of integration cycles) |
Frequency Range | <1 Hz to 15 Hz |
Signal Processing | Lock-in signal integration, cycle averaging, and image subtraction |
Supported Hardware | Keithley SMUs (2400, 2450, 2460, 2461, 2470), programmable power supplies, relay systems |
Output Data | Amplitude, phase, and single-phase thermal images |

Power Sensitivity
Increasing the number of lock-in test cycles results in improved power sensitivity. Power sensitivity improves proportionally to the square root of the number of integration cycles (√N). Hot spots that heat up less than 1 mK (0.001°C) and dissipate below 10 µW can be detected. Weak sources of heat arising during normal operation of the device can also be detected and localized.
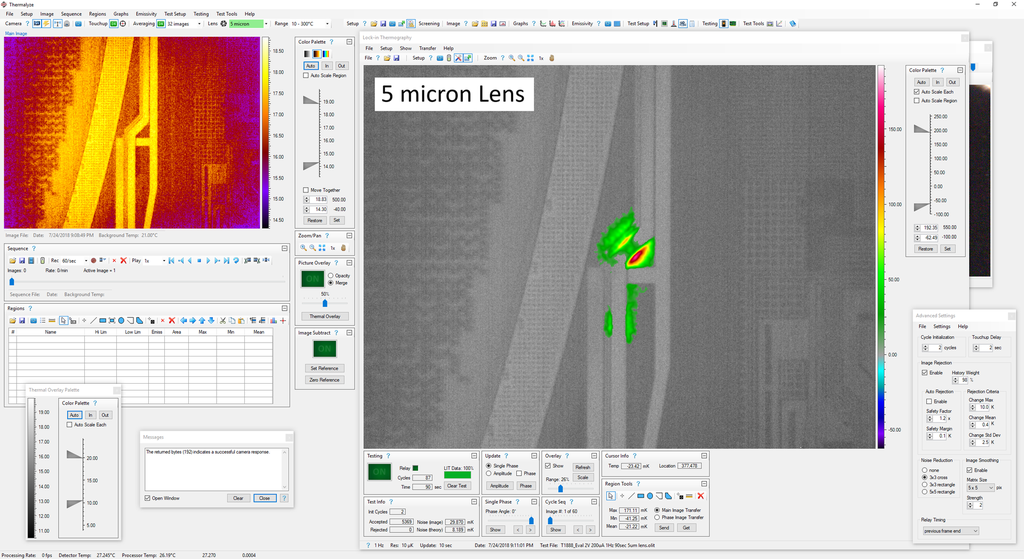
Frequency Range
The frequency of the applied periodic electrical stimulus (voltage) can be set from below 1 Hz up to 15 Hz. Performing lock-in tests at lower frequencies improves signal-to-noise ratio due to increased thermal response. Lower excitation frequencies improve sensitivity by increasing thermal signal amplitude, while higher frequencies enhance spatial resolution by limiting heat diffusion. This allows optimization based on the failure mode being analyzed.
Features
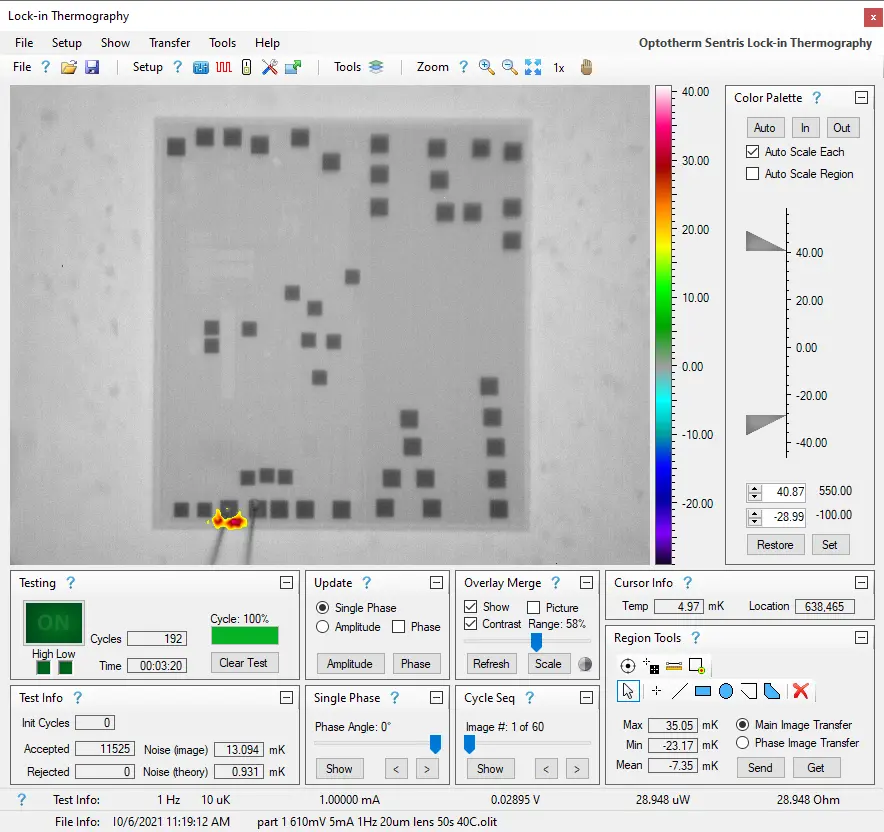
Test Images
Lock-in thermography generates multiple image types that provide insight for fault localization, signal strength, and defect depth analysis.
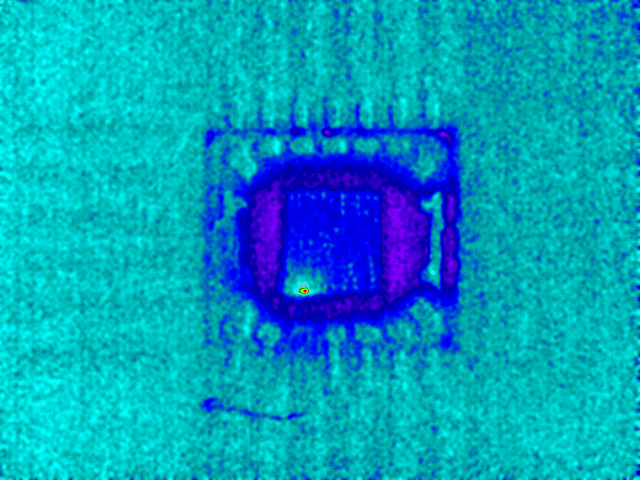
Single Phase Image
Shows thermal response at a specific time int he excitation cycle (highest spatial resolution)
A single phase image displays thermal response at a specific point within the excitation cycle, defined by phase angle. A phase angle of 0° corresponds to when voltage is applied, while negative values represent delayed thermal response within the cycle.
By isolating thermal behavior at a specific time, single phase imaging provides high spatial resolution for XY fault localization. It can also reveal defects that heat at different times, enabling correlation with defect depth. Single phase images typically provide the highest XY spatial resolution of all lock-in image types.
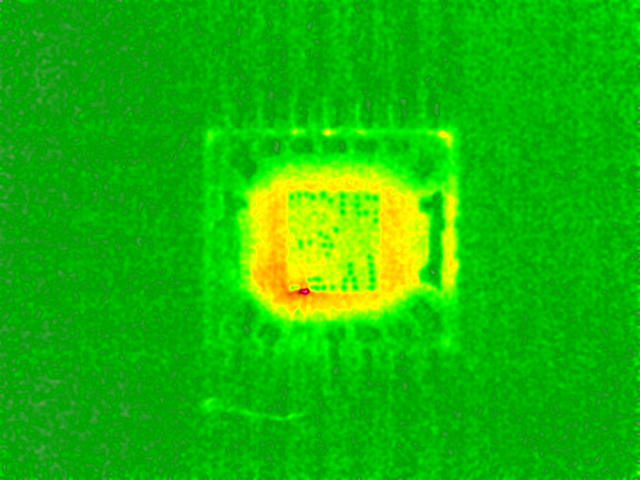
Amplitude Image
Shows total thermal response over the entire excitation cycle (best for fault localization)
An amplitude image integrates all temperature changes over the cycle into a single image, providing a strong signal for identifying and localizing faults in the XY plane.
It is typically used as the primary image for initial fault detection, as it highlights the overall magnitude of thermal activity regardless of when it occurs during the cycle.
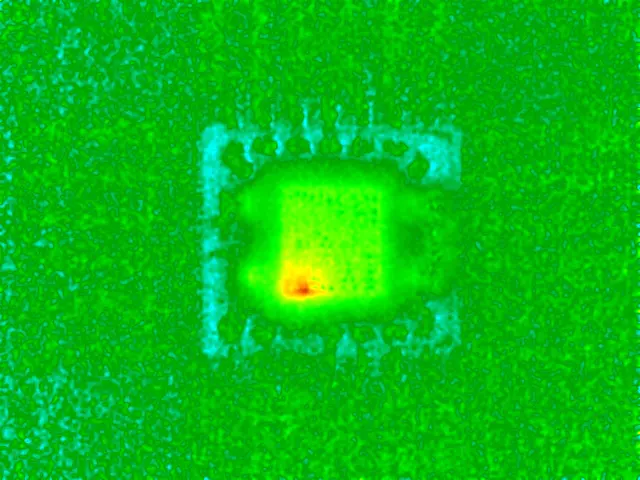
Phase Angle Image
Shows timing of heat propagation within the cycle (used for defect depth analysis)
The phase image displays the timing of thermal response at each point, expressed as a phase angle within the excitation cycle. Because heat from subsurface defects takes time to reach the surface, phase delay is correlated with defect depth. This makes phase imaging particularly useful for analyzing packaged devices and stacked die.
Phase angle is measured in degrees from 0° to -360°, where values near 0° indicate near-surface heating and more negative values indicate deeper heat sources.
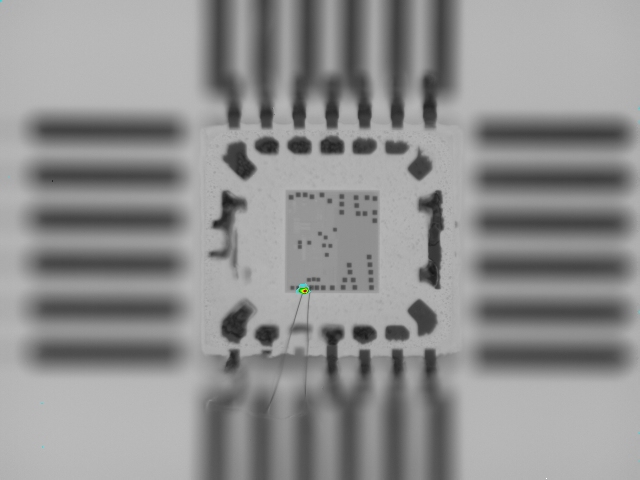
Thermal Overlay
A thermal overlay is a grayscale thermal image of the device produced by averaging all of the captured images that have been accepted in the lock-in test. When thousands of images have been accepted, the thermal overlay image noise is significantly reduced providing a high resolution image that can be merged with the single phase, amplitude, and phase angle images to facilitate locating fault xy coordinates.
Cycle Image
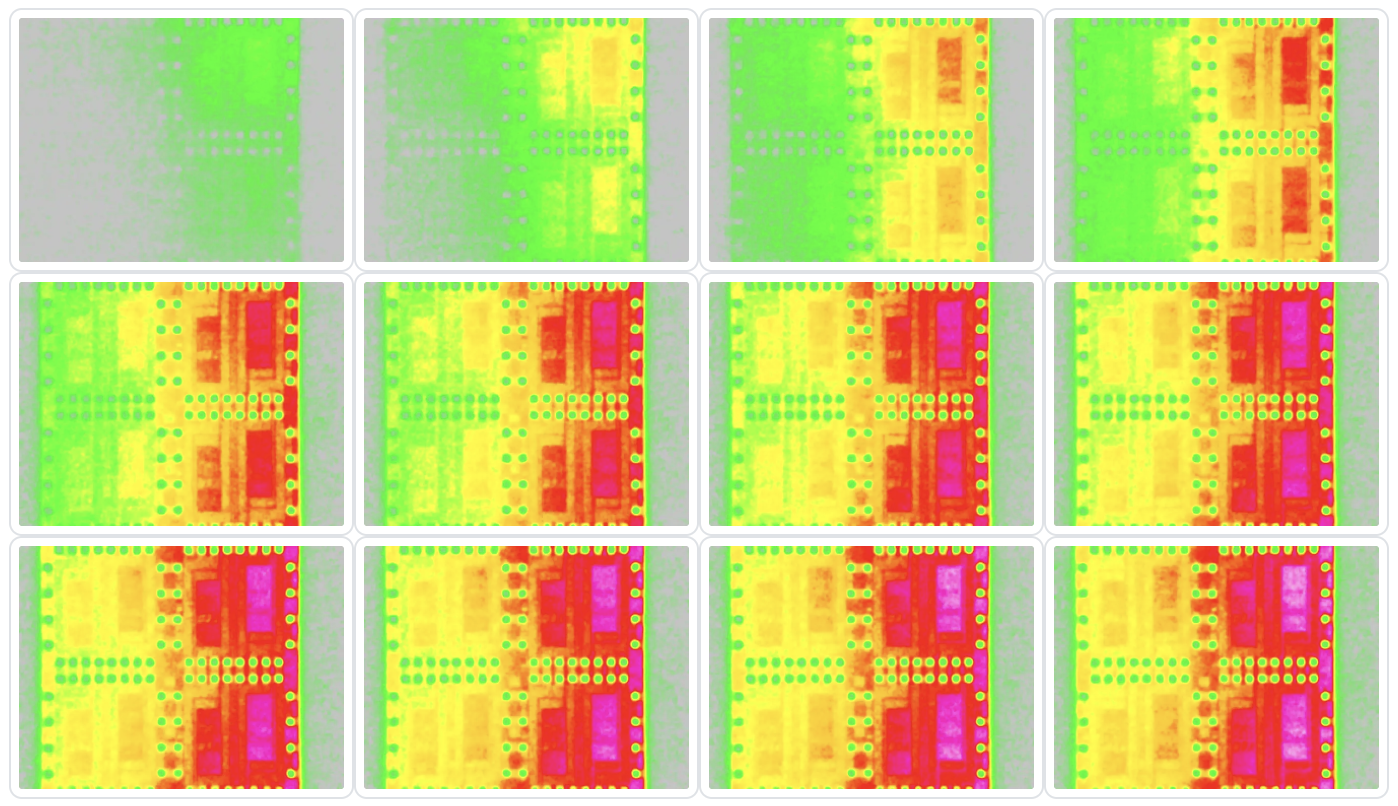
A cycle image displays device heating at a specific time during a cycle. Cycle images are useful for visualizing heat propagation across a device during the cycle.
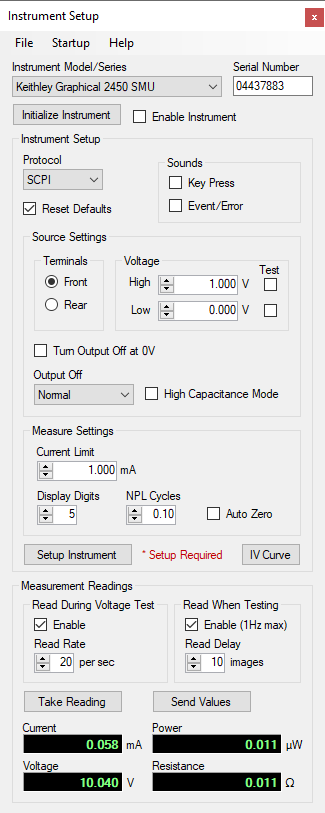
Instrument Control
The Instrument Setup window within Thermalyze is used to set up and control a Keithley voltage source (such as a source measure unit) via USB interface.
Voltage can be cycled between zero volts and a higher voltage, or between two non-zero voltages. Current flow and applied voltage are read from the instrument and displayed at the bottom of the window. To help operators determine appropriate test voltage, current limit and test time, fail site power dissipation and resistance are calculated and displayed.
Thermalyze Software
See the Thermalyze Help CHM documentation for Instrument Control software features and operation.
Supported Instrument Models
See the Thermalyze Help CHM documentation for a list of supported instrument models.
IV Curve Plotting
Plot the device current response to an applied voltage range.
Supported Instrument Models
- Keithley graphical SMU (source measure unit) models 2450, 2460, 2461, and 2470
- Keithley series standard 2400 source measure units (requires National Instruments USB GPIB controller model GPIB-USB-HS+)
- Keithley series 2280 DC power supplies
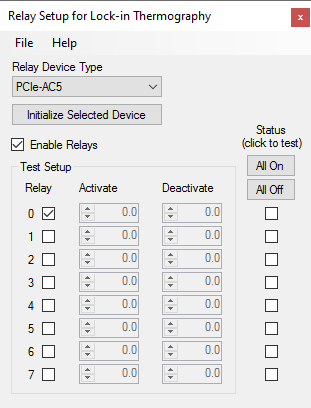
Relay Control
High frequency (up to 15 Hz) or high current (up to 6 Amp) mechanical relays can be used to control voltage from your existing source meter or power supply. Relay outputs can also be used to trigger external test equipment when more sophisticated device voltage control is required. Mechanical relays have zero leakage current in the off state which is an advantage when performing lock-in tests on devices with low leakage current.
Defect Depth
Determining fault depth in 3-dimensional system-in-package (3D SiP) devices is becoming increasingly important due to their expanding complexity and decreasing dimensions. As the number of stacked die in 3D SiP devices grows, isolating the root cause of defects within the package becomes more challenging. Sentris provides a non-destructive technique to localize the depth of faults through 3D SiP packages.
Phase Angle
Phase angle represents the time delay between powering a device and subsequent heating on its surface and can be used to estimate fault depth. The magnitude of time delay, or phase angle, is dependent on defect depth but also on the thermal conductance of materials within the device.
Phase angle is measured in units of degrees and has a range of 0 to -360 degrees. A phase angle of 0 degrees indicates device heating occurring immediately after power is applied and takes place at or near the surface. Negative phase angle values, such as -120 degrees, indicate device heating occurring at some time after power is applied and somewhat below the surface. Larger negative values of phase angle indicate heating occurring at even greater depths.
Applying Voltage
Many 3D SiP devices undergo an initialization process that is triggered at a specific voltage level. If the applied voltage is cycled between 0 and a value above the initialization voltage level, the initialization process may cause non-defect related power dissipation that can interfere with detecting the true fail site. In these cases, the device should be initialized before the lock-in test begins, and the applied voltage should be cycled between two voltages that are above the initialization voltage.
Additionally, some 3D SiP devices include on-chip voltage regulators and defect power dissipation may not correlate with on-off power cycling. In these cases, device test equipment may need to be synchronized with the lock-in cycles in order to activate fail sites.
Calculating Defect Depth
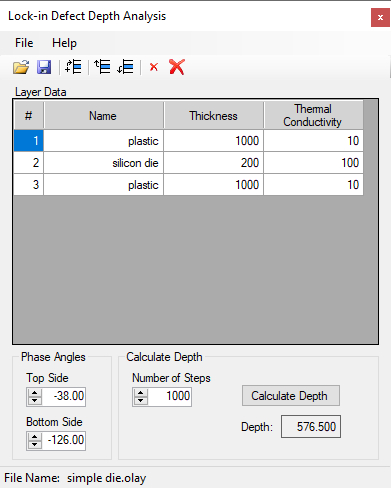
Method 1
3D SiP devices are complex structures comprised of multiple stacked semiconductor die, die-attach adhesive, and package mold compound. Modelling the thermal diffusion and phase relationships of heat originating from defect sites using thermal simulation software can be very difficult.
Sentris provides a simple method to describe the internal structure of a device by entering the thickness and thermal conductivity of each material layer. Phase angle data from testing the device on both the top and bottom sides is then entered to calculate defect depth.
Method 2
The thermal properties of die, adhesive, and mold compounds are often not known precisely and the interfaces between these materials makes the problem even more complex. In these cases, it may be more effective to estimate fault depth by correlating phase angle with the depth of known internal faults.
By measuring the phase angle of faults at known depths, a relationship between phase angle and depth can be plotted. This plot can then be used to estimate the depth of unknown faults by comparing their phase angle to the plot. This method requires phase angle results from only one side (top or bottom) of a device.
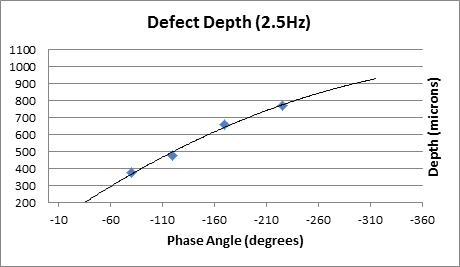
The relationship between phase angle and depth is dependent on both test frequency and fault power dissipation. For this reason, the power dissipated in the defect must remain consistent when performing all tests on a specific device. A suitable frequency should be selected that results in a high plot slope but also covers all potential fault depths. This will enable differentiation between different die levels more clearly. Standard procedure is to begin testing at 1 Hz and depending on the phase results of the test, raise or lower test frequency accordingly.
Method 3
This method is similar to method 2, however instead of measuring the phase angle of faults at known depths, internal reference heat sources are used. Internal I/O diodes located on multiple die levels are typically used as reference heat sources by forward biasing them. To create a defect depth plot, the device must be tested by cycling power to at least two reference heat sources whose depths are known.